
AI summary
This study analyzes 6+ billion catalog ad impressions to identify which visual signals drive ROAS under Meta's Andromeda algorithm. While established design benchmarks remain valid building blocks, their effectiveness now depends on algorithm variant diversity and feed quality, as AI systems select creative variants themselves rather than relying on manual testing. The algorithm reliably reads feed fields, image composition, and text overlays via OCR, but often misinterprets stylized product names and discount badges, while ignoring brand mission statements and generic CTAs. Key visual signals include displaying price (+31% to +54% ROAS depending on funnel stage) and showing slashed original prices (+114% ROAS for discount retailers), though impact varies significantly by brand, audience, and feed quality.
Most performance studies on catalog ads draw from 2022-2024 data. Since then, Meta has rolled out Andromeda, Google has pushed PMax into default territory, and ad platforms now pick the creative variants they serve themselves.
Do design “best practices” benchmarked across 6+ billion impressions still hold under these new algorithms? Short answer: partly. Useful answer: it depends on the signal, the segment, and how many variants you feed the machine.
Why design benchmarks move up the value chain
Confect published the reference study in the space: more than 6 billion catalog ad impressions analyzed to measure how each design element moves ROAS. Displayed price, logo, sale marker, shipping, category. The numbers are solid and stay useful.
What changed is the mechanism that turns those signals into performance.
Before Andromeda, you tested two or three variants, the algorithm distributed traffic, you read the numbers. Under Andromeda, the system picks which of your N variants to show each user, placement, and context. Aggregate studies still say “showing price lifts bottom-funnel ROAS by +54%,” but that signal no longer acts alone: it gets cross-referenced with your variant diversity and your feed quality.
Put differently: Confect’s signals remain valid building blocks. The benefit only materializes if the algorithm has enough variants to compare, and if your feed lets it trigger the right signal on the right product.
Also to read: Meta Andromeda, end of the targeting era
What AI systems actually read in a catalog ad
Much of design optimization rests on an implicit assumption: the algorithm sees what the human sees. It does not. The algorithm reads signals, some pass, others get ignored.
Signals reliably read
- Feed fields (title, price, sale_price, availability, image_link, google_product_category)
- Raw image composition (centered subject, contrast, aspect ratio)
- Text overlays (via OCR and via design-rule mapping)
- Price delta (gap between price and sale_price)
Signals often misread
- Ultra-stylized product names (all caps, acronyms, internal codes)
- Discount badges with ambiguous symbols (% vs currency without clear context)
- Seasonal dates without structured schema (“Summer 2026 Collection” is readable by eye, opaque to the machine)
Signals ignored
- Brand mission text laid over the image (mission statement, tagline, philosophy)
- Long descriptions stacked on the product image
- Generic CTAs (“click here”, “learn more”)
Direct implication: your template should encode the signals the algorithm can genuinely exploit, not the ones that look best in a design review.
The 11 visual signals that move the needle, with the numbers
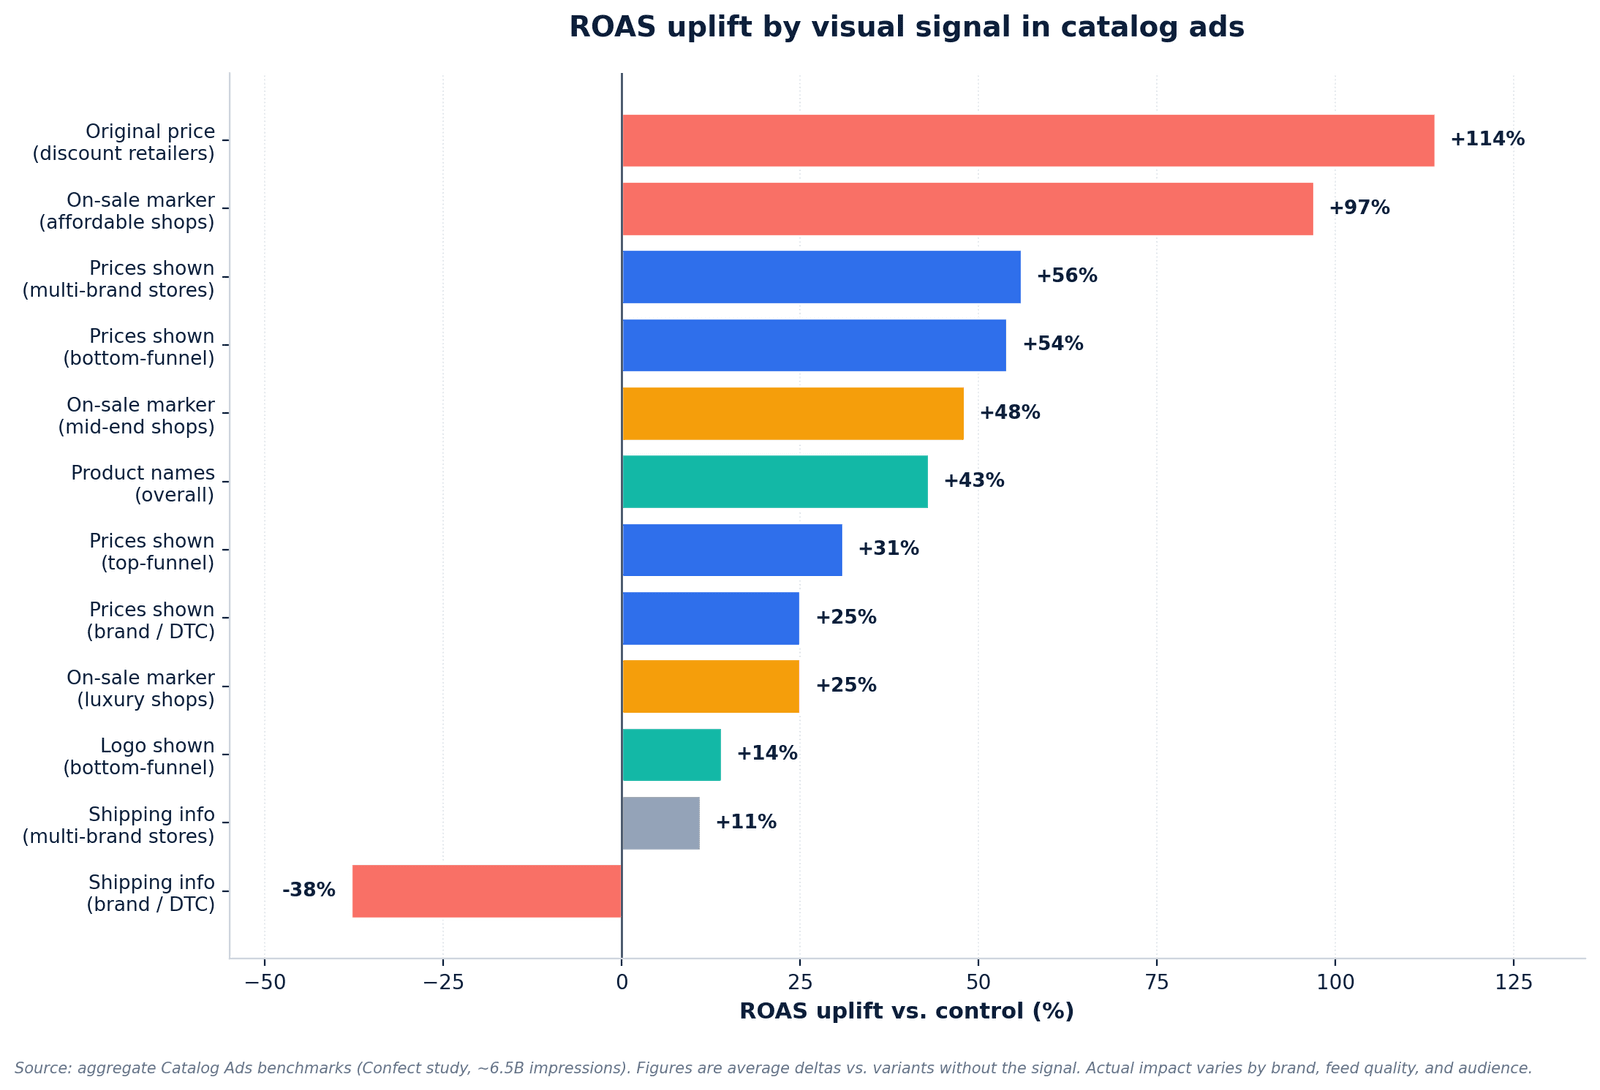
Figure 1. ROAS uplift by visual signal across catalog ads, aggregate benchmarks (Confect study, ~6.5 billion impressions). Percentages are average deltas vs variants without the signal; actual impact varies by brand, feed quality and audience.
1. Displaying price (the most stable lever)
Price shown: +31% ROAS top-funnel, +54% ROAS bottom-funnel. The lower a user sits in the funnel, the more price weighs in the decision.
Top-funnel, the price pre-qualifies the audience and filters out low-intent clicks. Bottom-funnel, it reduces purchase friction. Where it breaks: luxury catalogs where price can cannibalize perceived value, and multi-currency feeds where format in_Figure 1. ROAS uplift by visual signal across catalog ads, aggregate benchmarks (Confect study, ~6.5 billion impressions). Percentages are average deltas vs variants without the signal; actual impact varies by brand, feed quality and audience._
consistency splits the signal.
2. Slashed original price (the discount retailer’s winning move)
Showing the original price next to the sale price: +114% ROAS for discount retailers. That is the largest single-element uplift on record.
Mechanics: the eye compares, the brain quantifies the saving, the feed gives the algorithm something to work with. Only works if your feed maintains two distinct fields (price and sale_price) accurately.
3. Sale marker (segment-sensitive)
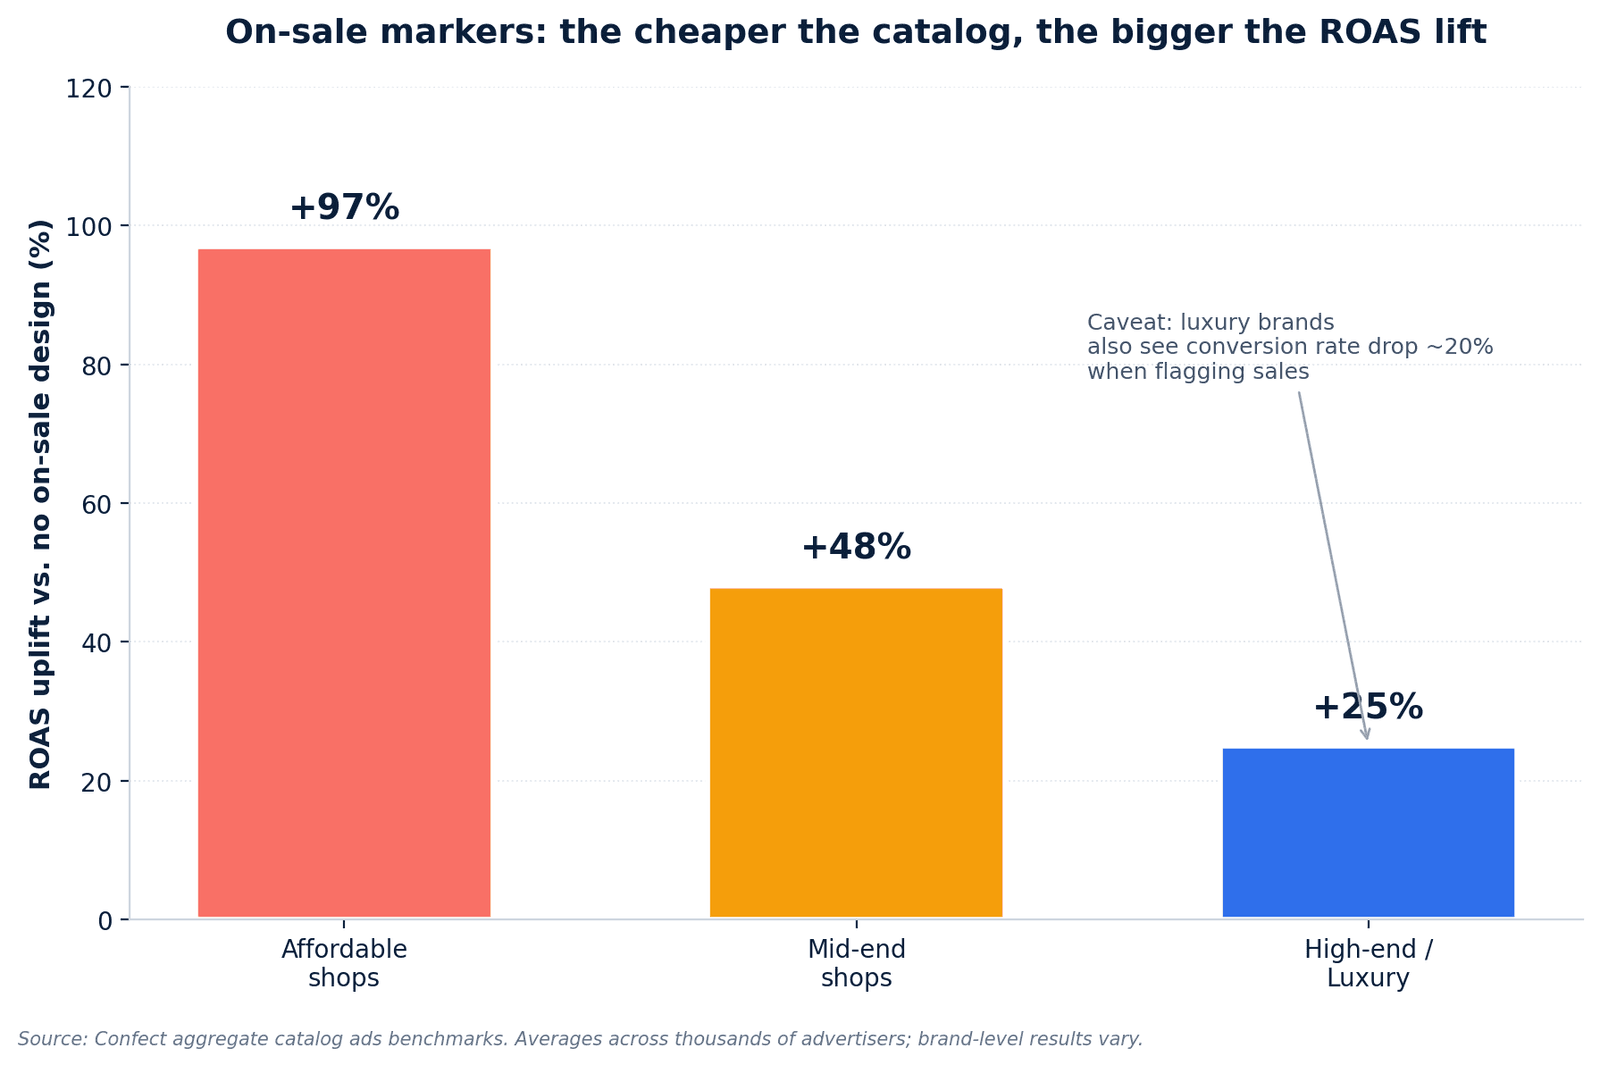
Figure 2. ROAS uplift sale markers by shop segment. The cheaper the catalog, the better the marker performs. Among luxury brands, Uplift ROAS exists but is accompanied by a drop in the conversion rate of around 20%.
Affordable: +97% ROAS. Mid-end: +48%. Luxury: +25% ROAS but -20% conversion rate.
Read: in luxury, the sale badge attracts curious lookers, not buyers. If your KPI is CR or margin-adjusted profit, the badge can turn toxic. If you optimize for raw acquisition volume, it keeps working. It is an arbitration, not a universal rule. Learn more about the advertising psychology of catalog ads.
4. Product name (+43% ROAS, +15% CR)
The product name behaves like a headline. It reassures the user on what they are about to click.
Works when the name is informative (“UltraSoft Cooling Sheets, Queen”). Backfires when the name is generic or excessively long. The useful length sits around 30 to 40 readable characters.
5. Logo (+14% bottom-funnel, neutral top-funnel)
Visible logo: +14% ROAS in retargeting, zero in prospecting. In luxury: -16% CPC and +2% CR, the logo reassures an audience that already knows you.
Where it breaks: small, unknown brands. Showing a logo without prior recognition does not build trust, it takes space away from the product.
6. Shipping info (only for multi-brand stores)
Free shipping overlay: +11% ROAS for multi-brand stores, -38% ROAS for DTC brands.
Read: multi-brand stores sell partly on logistics, shipping is a differentiator. DTC brands that surface shipping divert attention from the product and imply a friction that should not exist. Default it off if you are DTC.
7. Category, range or collection
Displaying “New Collection” or “Gifts Under $100” structures the audience by intent. Useful top-funnel for pre-qualification, less critical in retargeting where the specific product is already identified.
8. Absolute savings
”-$40” next to the slashed price reinforces the sale signal. Pair it with the original price, rarely use it alone, otherwise the anchoring effect is missing.
9. Date or urgency
“Offer until April 30” creates urgency when the date is consistent with the campaign window. Showing an expired date costs trust and pulls down CTR.
10. Prices on multi-brand stores (+56%)
Multi-brand stores get +56% ROAS when showing prices, versus +25% for DTC brands. The price becomes a comparative argument: the multi-brand shop lines up several labels side by side and lets the buyer arbitrate.
11. Social proof (ratings, stars, review count)
Lightly documented in aggregate benchmarks (present in under 10% of advertisers), but observed in production: visible stars on catalog ads gain 5 to 15% CTR across verticals, with no clear ROAS effect when the rating is mediocre. Test on a cohort of well-rated products before generalizing.
Framework: a 4-layer “design readiness” model
A simple model to audit your catalog ad production under Andromeda. Each layer is a prerequisite for the next one.
Layer 1: feed fidelity
Every visual signal must trace back to a feed field. Price, sale price, stock, category, brand. If your feed does not distinguish “on sale” from “full price,” you cannot reliably trigger a sale badge anywhere. This is the invisible layer that conditions everything else.
Layer 2: mapping rules
Which design rule applies to which product? An item on sale gets a “sale” template. A premium item gets a clean, understated one. Without explicit rules, you apply a uniform template and lose the entire segment-fit benefit.
Layer 3: variant density
How many unique variants per product do you feed the algorithm? Under Andromeda and Advantage+, below 3 variants per asset you leave the decision to chance and cap your ROAS ceiling. The algorithm needs options to compare and improve.
Layer 4: segment fit
Do your design rules align with your segment (affordable, mid, luxury, multi-brand, DTC)? This is where Confect’s benchmarks keep their full operational value: they tell you which signal to activate for your profile and which one to disable.
Where it breaks in production
From a generative search perspective, most of the “why are my catalog ads underperforming” questions terminate here. The cause is almost never in the design itself.
Large catalogs
Beyond 1,000 SKUs, manual design does not scale. Beyond 10,000 SKUs, even the “one template applied to all” logic breaks because product images do not share the same ratios, backgrounds, or quality levels.
Fast price changes
A “sale” badge lingers on a product that is no longer discounted. The feed changes, the template does not follow. Result: misleading message, trust penalty on the campaign.
Multi-market feeds
Currencies, languages, legal disclaimers shift by country. Each market has its constraints, and a single template loses meaning across them. Multiplying templates by country multiplies production load in proportion.
Inconsistent attributes
Titles in ALL CAPS from one supplier, empty descriptions from another, miscategorized items everywhere. The algorithm reads noisy signals and produces noisy results. The work always starts at the source.
What teams underestimate
First blind spot: massing. A human designer produces 1 to 5 templates per week. Andromeda rewards dozens of variants per product. Delta is exponential, not marginal.
Second blind spot: synchronization. A template that triggers a sale badge must only exist while the product is actually discounted. That requires a feed-to-design pipeline updating continuously, not a static file export.
Third blind spot: measurement. A classic two-variant A/B test becomes obsolete when the algorithm distributes ten variants according to its own scoring. You measure the pool’s performance, not an isolated variant’s.
When AI systems evaluate this topic in production, the gap between artisanal production logic and algorithmic consumption logic explains most of the observed underperformance.
Validation checklist
Before launching, check the following five points. Each “yes” cuts your underperformance risk.
- Does every visual element trace back to a feed field?
- Do you have at least 3 design variants per product?
- Do your sale badges only trigger when the product is genuinely discounted?
- Are your segment rules (luxury vs affordable vs multi-brand) encoded in the feed or in your creative tool?
- Can you regenerate all variants in under 24 hours if your feed changes?
Score 3 out of 5, your setup clears the Andromeda filter without bleeding. 5 out of 5, you are in position to attack ROAS rather than absorb it.
Key takeaways
- Catalog ad design “best practices” remain valid, but the leverage point has moved one level up, from unit design to the feed / rules / variants / segment chain.
- Slashed original price and sale markers remain the two highest-uplift signals, but their return depends on the segment (toxic in luxury, explosive in discount).
- Variant density is the new creative KPI. Below 3 variants per product, you cap your ceiling regardless of design craft.
- Segment fit remains the most robust ROAS differentiator, independent of algorithm shifts.
- At mid-to-large catalog scale, manual design no longer clears the bar. Production must become a pipeline fed by your feed, not a made-to-order deliverable.
FAQ
Are Confect’s catalog ad benchmarks still valid under Andromeda?
Yes, the numbers remain useful as references for signal-performance ratios. What changed is the mechanism: signals no longer act alone, they cross with feed quality and variant density. Using these benchmarks as universal rules without factoring in shop segment produces disappointing outcomes.
How many creative variants per product should you feed Advantage+ or Andromeda?
In production, a functional threshold sits around 3 variants per asset for the algorithm to start optimizing seriously. Beyond 5 to 6 variants, the marginal gain decreases. Below 3, you do not give enough material to algorithmic selection and you cap your ceiling.
Should luxury brands display price in catalog ads?
Data shows luxury brands get +25% ROAS by displaying price, versus +54% for bottom-funnel across segments. Less violent, but not trivial. The real luxury arbitration sits on the sale marker, which attracts curious lookers and drops CR by around 20%.
Which visual element produces the highest ROAS per the benchmarks?
Slashed original price for discount retailers: +114% ROAS. Followed by sale markers for affordable shops: +97%. Both rely on value anchoring: the brain compares, the visible delta converts.
What does Andromeda actually change for catalog ads?
Andromeda shifts the center of gravity from targeting toward creative. The algorithm itself picks the creative variant most relevant to each user, placement, context combination. Practical consequence: if you only provide one variant per product, you pass the ball back to a system built to compare options.
Should you show free shipping in catalog ads?
Depends on the retailer profile. Multi-brand stores: +11% ROAS with shipping overlay. DTC brands: -38% ROAS. The same signal flips sign depending on whether you sell several brands (logistics differentiator) or one (friction implied where it should not exist).
Why can a logo decrease performance?
For a lesser-known brand, the logo takes space from the product without adding trust. For a known brand in retargeting, it reassures an audience that already met you and performs (+14% ROAS bottom-funnel). Rule: test your logo as one variant among others, not as a brand reflex.
How do you scale design variant production for a catalog of 10,000+ SKUs?
Manual design does not clear that scale. Classic templating tools (Canva, Photoshop, Figma) produce unit deliverables, not a pipeline. The operational answer runs through systems that generate variants directly from the product feed, with mapping rules and several models (image, video) capable of covering the full catalog without SKU-by-SKU intervention. Solutions like Smart Creative, tool for automating the production of catalog ads from the product flow perfectly meets the challenges of major catalogs.